Introduction
The goal of this lab is to perform write function memory change detection and post-classification change detection on Landsat TM imagery. Write memory change detection is a quick way to analyze an image qualitatively while post-classification change detection is a more in depth method that allows for one to quantify the from-to change of LULC.
Methods
Write Function Memory Insertion Change Detection
Write Function Memory Insertion is a simple way to visually see change over an area over a given period of time. It is quick to perform, but it doesn't provide the user with any quantitative data. In this part of the lab, Landsat imagery from 2011 and 1991 of west central Wisconsin will be used.
Write Function Memory Insertion is a simple way to visually see change over an area over a given period of time. It is quick to perform, but it doesn't provide the user with any quantitative data. In this part of the lab, Landsat imagery from 2011 and 1991 of west central Wisconsin will be used.
The first step to performing this change detection is creating a layer stack of the red band of the newest image, and the two near infrared bands of the old image. After this composite image is created, the bands which go into the blue, red, and green channels are changed so that the red band of the newest image is inserted into the red chanel, and the two near infrared bands of the older image is inserted into the green and blue channels. This is done in the Set Layer Combinations window which can be found in the Multispectral tab in Erdas. The Set Layer Combinations window for this image is shown below in Figure 1.
Post-Classification Comparison Change Detection
Post-classification change detection is a much more in depth method than the write function memory insertion technique is. In this lab, LULC from 2001 and 2011 of the Milwaukee Metropolitan Statistical Area (MSA) will be used. Post-classification change detection allows for the determination of from-to change of a given LULC for a given pixel.
Before this, though, a chart of the from-to change detection was created using the raster attributes of both LULC datasets. This table was created in Excel to show the area in Ha for each LULC class as well as the percent change in LULC for each class.
To create a from-to change map using the post-classification comparison change detection method. The equation used to determine the changes is shown below in Figure 2, and is explain below.
 |
| Fig 1: Set Layer Window |
Post-classification change detection is a much more in depth method than the write function memory insertion technique is. In this lab, LULC from 2001 and 2011 of the Milwaukee Metropolitan Statistical Area (MSA) will be used. Post-classification change detection allows for the determination of from-to change of a given LULC for a given pixel.
Before this, though, a chart of the from-to change detection was created using the raster attributes of both LULC datasets. This table was created in Excel to show the area in Ha for each LULC class as well as the percent change in LULC for each class.
To create a from-to change map using the post-classification comparison change detection method. The equation used to determine the changes is shown below in Figure 2, and is explain below.
 |
| Fig 2: Equation used to determine change for each LULC class |
Below is a list which explain what all the symbols mean in the equation.
1. ΔLUC = the from-to change class
2. IM1 = the classified image for date 1
3. IM2 = the classified image for date 2
4. v1….vn = Class values
5. vt = classes not interested in for a particular sub-model
6. set{0,1}= mask classes not interested in but highlight interested class.
7. 1a = From pixel value of interested class.
8. 1b = To pixel value of interested class.
This equation is then used to create a model in Erdas. To save time, a single model was created using the two LULC rasters as inputs and all of the LULC change sub models were inserted into a single model. Therefore, the model will output 5 different rasters which show the from-to change for each LULC class.
 |
| Fig 3: Full model |
To help explain the model, Figure 4 shows just the part for the Urban/Built up LULC from-to change.
 |
| Fig 4: Model for Urban/built up for from-to change |
In the first function of the model the equation used is "EITHER 1 IF ($n1_milwaukee_2001==7) OR 0 OTHERWISE" for the 2001 input raster and is "EITHER 1 IF ($n2_milwaukee_2011==7) OR 0 OTHERWISE" for the 2011 input raster. Then, these values are concatenated using another function by using the concatenation operator so that the function reads " $n30_memory & $n31_memory ". Similar statements were added to the model for the corresponding input functions to complete the model. After the statements were written in the model, the model was ran.
Results
Figure 5 shows the output of executing write function memory change detection. The areas that changed the most are shown in red, and the areas that changed the least area shown in blue. Based on the image, it appears that urban areas changed more than agricultural and forested areas. This is probably because buildings were constructed, roads were built, and other infrastructure was created near the populated areas while agricultural areas did not have this occur.
 |
| Fig 5: Write Memory Change Detection Outut |
Figure 6 shows the table created from the data in the raster attributes of the 2000 and 2011 images. The table shows that water, wetland, urban/builtup, forest, and agriculture didn't change very much, and shows that open space, and bare soil LULC changed quite a bit when comparing the 2011 image to the 2000 one. However, it is important to note that only 1000 more Ha were classified as bare soil in 2011 than in 2000 while having a 72% change, and that 2500 more Ha were classified as Urban/built up in 2011 than in 2000 coming to only a 2.7% change. It is important to remember that the percent change column is only relative to the original Ha LULC value.
 |
| Fig 6: Changed in LULC in Milwaukee MSA |
Figure 7 shows a map of all the from-to change rasters created in the large model in Model Maker. This map shows that visually, it appears that most LULC change that occurred was from agriculture to urban. This is most likely because the Milwaukee area population is growing and in order for more houses to be created agricultural areas must be turned into houses. This map also helps show that there wasn't much wetland to agriculture change in the Milwaukee area, and that there wasn't much wetland to urban change in the Milwaukee area either.
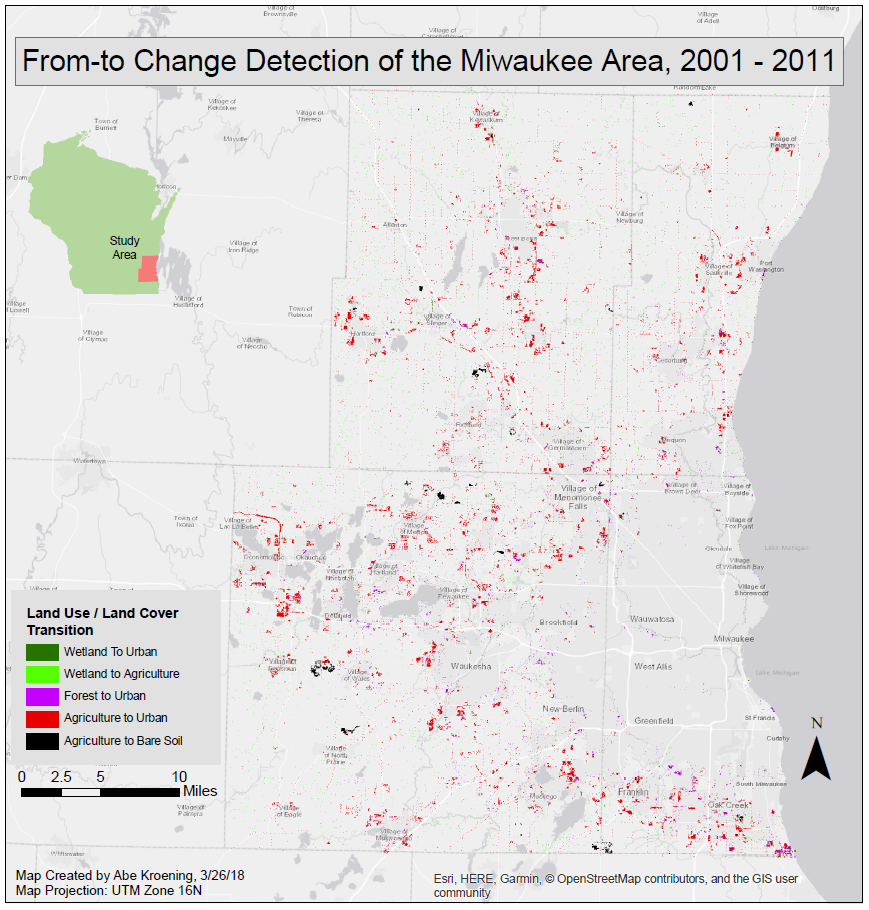 |
| Fig 7: From-to LULC change map created using post-classification comparison change detection |
Sources
Esri, 2017. US GeodatabaseUnited States Geological Survey, 2017. Earth Resources Observation and Science Center
Multi-Resolution Land Characteristics Consortium (MRLC), 2011. National Landcover Dataset
Wilson, C (2017) Lab 6 Digital Change Detection retrieved from
https://drive.google.com/open?id=1poMZ9VtbA_F-mknQlM5dvf5WDylELvN-
No comments:
Post a Comment