Introduction
This lab covers three different atmospheric correction methods. One is relative and two are absolute. The absolute methods include the Empirical Line Calibration (ELC) and the Dark Object Subtraction (DOS) method, and the relative method is the Multidate Image Normalization method. For the ELC and DOS methods, Landsat 5 imagery will be used from the Eau Claire area. For the Multidate Image Normalization method Landsat 5 imagery centered around Chicago will be used.Methods
Empirical Line Calibration (ELC)Empirical Line Calibration is performed by using the equation: CRk = DNk * Mk + Lk where:
- CRk = corrected digital output pixel values for a band (k)
- DNk = the image band(s) to be corrected
- Mk = a multiplicative term affecting the brightness values on the image*
- Lk = an additive term*
 |
| Fig 1: Emperical Line Equation and Graph |
After collected each of these and comparing them to their respective spectral signature in the library, a linear equation for each band was made. The graph of this equation for band 7 can be seen to the right in Figure 1. This figure also contains the slope and intercept information which will be used to derive an atmospherically corrected image.
To use this model to create the corrected image, the View-Preprocess-Atmospheric Adjustment button was clicked and then the output was saved.
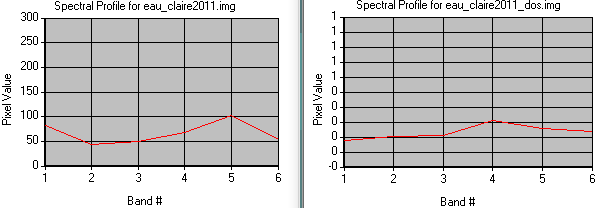
Then, spectral profiles were compared with each other from the original image to the atmospherically corrected image. This was done for the roadway, coniferous forest, grass, aluminum roof, and water surfaces.
Dark Object Subtraction (DOS)
Dark Object Subtraction correction takes into account a few more variables than ELC correction does. It accounts for sensor gain, offset, solar irradiance, solar zenith angle, atmospheric scattering and absorption, and path radiance. DOS is a two step process. The first step is to convert the raw imagery to at-satellite radiance which is done by using the equation L = (LMAX - LMIN) / (Qcal max - Qcal min) * (Qcal - Qcal min) + LMIN where:
- L = the at-satellite radiance
- Qcal = Landsat image
- Qcal min = found in meta data
- Qcal max = found in meta data
- LMAX = found in meta data
- LMIN = found in meta data
 |
| Fig 2: Calculating At-Satellite Radiance Using Model Maker |
- R = true surface reflectance
- π = the number pi (3.1415926535)
- D² = the distance between the earth and sun squared in astronomical units
- L = the at-satellite radiance image
- Lhaze = path radiance
- TAUv = atmospheric transmittance from ground to sensor
- Esun = the mean atmospheric spectral irradiance
- Cos(Θ) = the cosine of the sun zenith angle
- TAUz = the atmospheric transmittance from the sun to the ground
This equation was applied to the at-satellite radiance image from above and from the meta data from the Landsat 5 image and then was performed in Model Maker which can be seen below in Figure 3. The equation for band 1 can be seen in the Function Definition window. Next, a layer stack was performed on the output bands to create a composite. Then, radiometric differences were looked at between the original Landsat 5 image and the DOS atmospherically corrected image.
 |
| Fig 3: Calculating True Surface Reflectance Using Model Maker |
Multidate Image Normalization
Multidate Image Normalization normalizes one image to another. The images were taken at different times. For this analysis, the Landsat image of Chicago from 2009 will be normalized to the the Landsat image of Chicago from 2000.
The first step to perform Multidate Image Normalization is to create spectral profiles for both images. Then, by exporting the mean values from the bands into Excel, a linear regression equation can be created: Lsensor = Gain * DN + Bias where
- Lsensor = the normalized at satellite radiance image
- Gain = the regression coefficient determined by the the spectral profiles
- DN = the band to be used (the 2009 bands in this case)
- Bias = the y intercept of the calculated equation from the spectral profiles
 |
| Fig 4: Excel Mean Data |
 |
| Fig 5: Band 3 Graph |
 |
| Fig 6: Model for Normalizing the Chicago 2009 image to the Chicago 2000 image |
Results
Figure 7 shows the results of the ELC atmospheric correction. This image doesn't appear any different than a regular nir Landsat image from this view, but slight differences can be seen when comparing spectral profiles.
 |
| Fig 7: ELC Atmospherically Corrected Image |
 |
| Fig 8: Comparing Spectral Profiles |
Figure 9 shows the result of the DOS correction method. Once again, this image doesn't look any different from this view than a regular nir Landsat image. To see the difference better the spectral profiles can be looked at.
 |
| Fig 9: DOS Atmospherically Corrected Image |
Figure 10 shows the spectral profiles of a road for the DOS corrected image and the regular image. Similar to the ELC mehod, the DOS method causes there to decrease reflectance in the blue band.
 |
| Fig 10: Comparing Spectral Profiles |
Figure 11 shows the output of the Multidate Image Normalization. Visually, this image actually looks different from its original image, but not by much. To see the actual change in the images the spectral profiles were looked at.
 |
| Fig 11: Normalized Chicago 2009 Image |
 |
| Fig 12: Analyzing Spectral Profile of Water |
Sources
Nasa. (2016). ASTER Spectral LibraryUnited States Geological Survey. (2017). Earth Resources Observation and Science Center
United States Geological Survey. (2016). USGS Spectral Library
Wilson, C (2017) Lab 2 Radiometric and Atmospheric Correction retrieved from
https://drive.google.com/open?id=1qs7ux8sXMDumARV_Lq-YV2oKk8gNc7oV
No comments:
Post a Comment