Introduction
This lab looks at calculating surface radiant temperature by using the thermal bands of satellite imagery captured by Landsat TM, ETM +, and 8. The wavelength of the thermal band in Landsat TM and ETM+ is 10.4 µm to 12.5 µm and the wavelength of the thermal band for Landsat 8 is 10.6 µm to 11.19 µm. There are three main steps to convert the thermal bands to a kinetic temperature surface. the first is to convert the thermal band to at satellite spectral radiance, the second is to convert the at satellite spectral radiance to radiant temperatures, and the third is to convert the radiant temperatures to kinetic temperatures. This process is detailed below for all three sensors.Methods
As stated above, converting thermal bands to a temperature surface is a two step process. The first step is to use the thermal band to determine the at satellite spectral radiance. All of the variables can be found in the meta data files for the This is done by using the equation Ll = Grescale * DN + Brescale where:
Calculating Surface Radiant Temperature with ETM+- Ll is the at satellite spectral radiance (a raster output)
- Grescale is (LMAX-LMIN) / (QCALMAX-QCALMIN)
- DN is the thermal band
- Brescale is LMIN
Once one has at satellite radiance (Ll) one can the advance to step two and calculate the radiant temperature. This is done by using the equation Tb = K2 / Log( [K1/Ll] + 1) where:
- Tb is the radiant temperature (°K)
- K1 and K2 are calibration constants
- Ll is the at satellite spectral radiance raster
This is done by using the model maker in Erdas Imagine. Two separate models were created for this sensor, one for each equation above. Figure 1 shows the first model where the at satellite spectral radiance was calculated. The LMAX, LMIN, QCALMAX, QCALMIN values were all looked up in the meta data text file in Notepadd ++.
 |
| Fig 1: Calculating the at Satellite Spectral Radiance |
 |
| Fig 2: Calculating the Radiant Temperature from the At Satellite Radiance |
Calculating Surface Radiant Temperature with TM
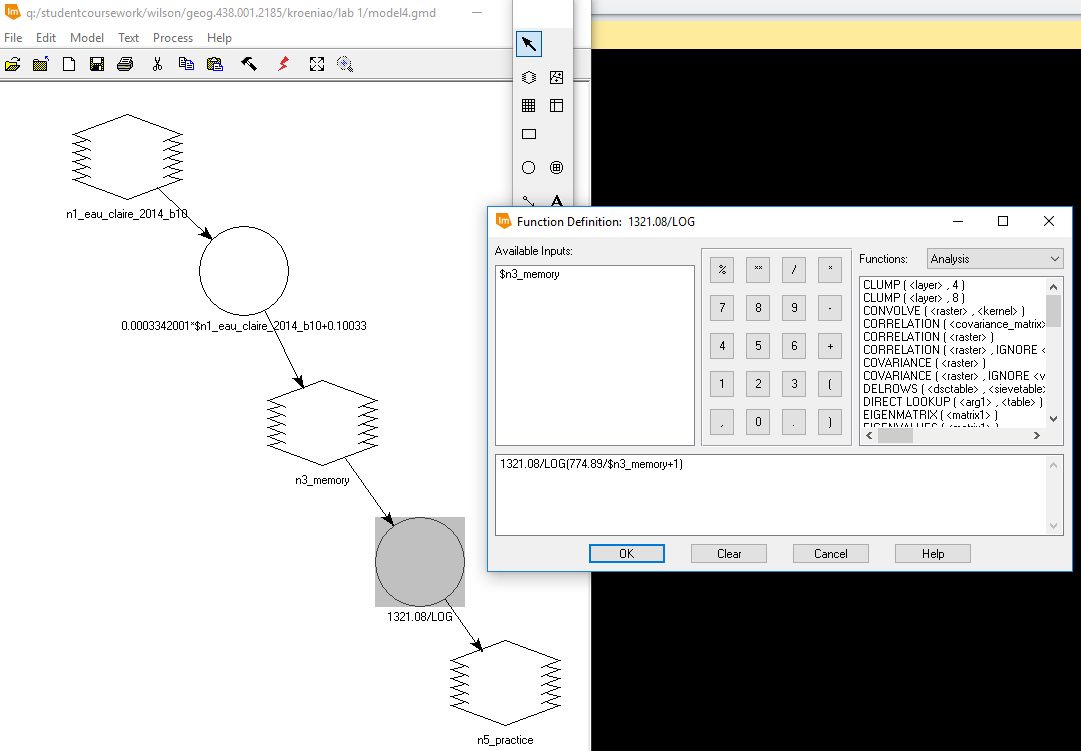
This was also done by using the model maker in Erdas. Instead of using two models to create the surface radiant temperature raster, it was combined into a single model. This can be seen below in Figure 3. There are two functions in the model. The first one, calculates the at satellite spectral radiance. The output of the first function is a temporary raster which is stored in memory. Then, this temporary raster is used in the second function which calculates the radiant surface temperature. This output is stored as float single.The data for the inputs was found by using the meta data file.
 |
| Fig 3: Model for Calculating Surface Radiant Temperature |
Just like with the TM satellite data, the Landsat 8 thermal band was used the same way to calculate the radiant surface temperature in a single model. This model can be seen below in Figure 4. The first function calculates the at satellite spectral radiance and stores the output as a temporary raster, and the second function is used to calculate the radiant surface temperature with a float single data type. The data for the inputs was found by using the meta data file.
Next, a subset of this raster was created so that only Chippewa and Eau Claire counties were included. Then, once brought into ArcMap, the raster values were converted to °F, and the extract by mask tool was used to help the raster have the defined boundaries of the counties. This helps to get rid of false data values outside the study area.
 |
| Fig 4: Calculating Radiant Surface Temperature for Landsat 8 |
Results
ETM+
Below is a screenshot of the surface temperatures calculated on June 6th, 2000. When the data was brought into ArcMap, there were a bunch of false values that showed up the outside the satellite scene. This value of 237.218 was set to display no color. Because the classification scheme used was stretched, this value still plays a factor for the other hues representing the other temperatures. The highest temperature in the scene is 317.945 °K and the lowest temperature is 288.450. The lowest temperature is a rough estimate because of all the false values. This raster shows that there tends to be higher temperatures in urban areas and cooler temperatures in rural areas.
Below is a screenshot of the surface temperatures calculated on June 6th, 2000. When the data was brought into ArcMap, there were a bunch of false values that showed up the outside the satellite scene. This value of 237.218 was set to display no color. Because the classification scheme used was stretched, this value still plays a factor for the other hues representing the other temperatures. The highest temperature in the scene is 317.945 °K and the lowest temperature is 288.450. The lowest temperature is a rough estimate because of all the false values. This raster shows that there tends to be higher temperatures in urban areas and cooler temperatures in rural areas.
 |
| Fig 5: ETM+ Radiant Surface Temperature Image |
Landsat TM
Below is a screenshot of the surface temperatures calculated on August 3rd, 2011. When the data was brought into ArcMap, there were a bunch of false values that showed up the outside the satellite scene. This value of 203.371 was set to display no color. Because the classification scheme used was stretched, this value still plays a factor for the other hues representing the other temperatures. The highest temperature in the scene is 321.309 °K and the lowest temperature is 295.681. The lowest temperature is a rough estimate because of all the false values. Also, because of the extreme low values for both rasters, although the actual values of the pixels in the scene are similar, it is difficult to draw comparisons visually because of the difference in color. This raster shows that there tends to be higher temperatures in urban areas and cooler temperatures in rural areas.
Below is a screenshot of the surface temperatures calculated on August 3rd, 2011. When the data was brought into ArcMap, there were a bunch of false values that showed up the outside the satellite scene. This value of 203.371 was set to display no color. Because the classification scheme used was stretched, this value still plays a factor for the other hues representing the other temperatures. The highest temperature in the scene is 321.309 °K and the lowest temperature is 295.681. The lowest temperature is a rough estimate because of all the false values. Also, because of the extreme low values for both rasters, although the actual values of the pixels in the scene are similar, it is difficult to draw comparisons visually because of the difference in color. This raster shows that there tends to be higher temperatures in urban areas and cooler temperatures in rural areas.
 | |
|
Landsat 8
Below is a map created from the radiant surface temperature on May 23rd, 2014 from Landsat 8. Unlike the above rasters, this one didn't contain a bunch of false values because the extract by mask tool was used, so the color scheme helps to visualize the raster well. The lowest temperature is 50.45 °F and the highest temperature is 111.2 °F. In general, lower temperatures are located more in the north east and where water bodies are present, and higher temperatures are located more in the west and south.
Below is a map created from the radiant surface temperature on May 23rd, 2014 from Landsat 8. Unlike the above rasters, this one didn't contain a bunch of false values because the extract by mask tool was used, so the color scheme helps to visualize the raster well. The lowest temperature is 50.45 °F and the highest temperature is 111.2 °F. In general, lower temperatures are located more in the north east and where water bodies are present, and higher temperatures are located more in the west and south.
 |
| Fig 7: Landsat 8 TM Radiant Surface Temperature Image |
Sources
Bureau, U.S (2017). factfinder.census.gov. Retrived from american Fact Finderhttps://factfinder.census.gov/faces/nav/jsf/pages/searchresults.xhtml?refresh=t
United States Geological Survey. (2017).Earth Resources Observation and Science Center
Wilson, C (2017) Lab 1 Surface Temperature Extraction from Thermal Remote Sensing Data retrieved from
https://drive.google.com/file/d/1ffHly8Z1ELm1RavcUFlM0IXvUbgbTSfI/view?usp=sharing
No comments:
Post a Comment